 Graph: Predator-Prey Relationship
 The students were very excited today to learn about different reading strategies. Many students find such concepts a little bit boring. However, I was happy to see all the look of excitement on everyone's faces when we learned about connections, visualizations, inferences, skimming, scanning, etc. We modelled how to use some of the strategies and the students had practice putting these strategies to work! You did great today everyone! Have a Happy Thanksgiving!
LEARNING INTENTIONS: To use different reading strategies to deepen your understanding of the reading material.
1.) LA:
2.) MATH 6:
MATH 7: Any assigned work. Check your teacher's website.
3.) POST A RESPONSE:
VIDEO LINKS:
Good Times with Primes
LEARNING INTENTIONS: To use different reading strategies to deepen your understanding of the reading material.
1.) LA:
- Play around with your Animoto account and make a quick video of your what you did over the Thanksgiving weekend! If you have a mobile device, download the app and it will make things much easier for you! If you like, you can show your classmates on Tuesday, or you can post a link to your video here over the weekend.
2.) MATH 6:
- Watch this short video clip on 'GOOD TIMES WITH PRIMES' with your parents to prepare you for Tuesday's math class! HINT: I wonder if you will have a pop quiz on prime numbers? ;-)
- We will be having 'GOOD TIMES WITH PRIMES' in Math next week! I know how excited all of you must be! WOOT! WOOT!
MATH 7: Any assigned work. Check your teacher's website.
3.) POST A RESPONSE:
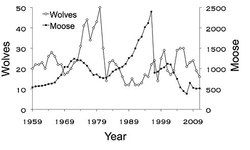
- Click here to view a graph of the predator-prey relationship between the moose and the wolf. Answer the following questions using full and complete sentences. This means you must pay attention to the conventions of writing: spelling, grammar, capitals, structure, etc.
- What two things does this graph compare?
- What is range of years that is shown on this graph?
- What does the legend show?
- For every 500 Moose, how many wolves are represented?
- In ~ which year was the moose population the highest and how many were present? Pay attention to the scale on the bottom of the graph. Before answering this question and the next 3, Ask yourself, "How many years does each space represent?"
- In ~ which year was the moose population the lowest and how many were present?
- In ~ which year was the wolf population the highest and how many were present?
- In ~ which year was the wolf population the lowest and how many were present?
- Explain why you think the moose population was so high in the year ~1980.
- Explain why you think the wolf population was so high in the year ~1996.
- ~ means approximately
VIDEO LINKS:
Good Times with Primes


 RSS Feed
