 Image Credit: Nathan Crock
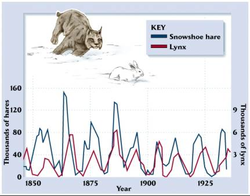
 Today, the students learned alongside their little buddies from Mrs. Nowotny/Scott's class. Our little buddies are currently working on human-made structures, animal made structures, and natural structures. The grade 6/7 students are currently learning about ecosystems. They were able to use a nested circle to zoom in on ecosystems within ecosystems. In addition to this, they also worked on interpreting predator/prey graphs by using the different data and text features present in a graph.
LEARNING INTENTION: To understand and interpret data from a predator/prey graph.
1.) LA:
2.) MATH 6: Play the 'PUMPKIN MULTIPLE' video game! It's loads of fun!
MATH 7: Check your teacher's website
3.) POST A RESPONSE:
Princessa's Square Dance Performance
LEARNING INTENTION: To understand and interpret data from a predator/prey graph.
1.) LA:
- Read the article titled 'Comprehension: Photographing Animals'
- Answer questions #1-4
2.) MATH 6: Play the 'PUMPKIN MULTIPLE' video game! It's loads of fun!
MATH 7: Check your teacher's website
3.) POST A RESPONSE:
- Today, you learned how to interpret and analyze a graph that contains some simple data. Click here to see the 'SURPRISE GRAPH'!
- Based on what you learned today, answer the following questions:
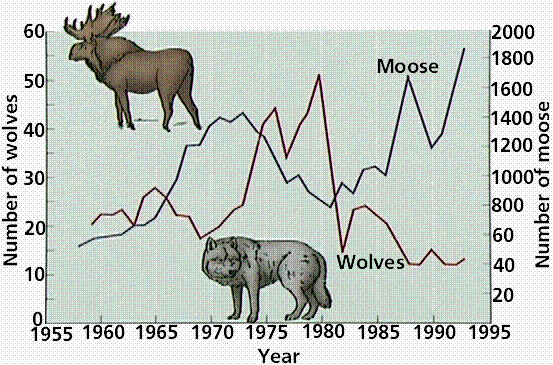
- How did the Isle Royale wolf population change between 1977 and 1980?
- How did the moose population change during that same period?
- How did the wolf population change between 1986 and 1988?
- How did the moose population change during that same period?
- What is one reason that might be why the moose population dropped between 1974 and 1981?
- BONUS: Explain any theories that you have that could possibly explain why the wolf and moose population increased and decreased?
Princessa's Square Dance Performance


 RSS Feed
